How to Select a Great Area for Land Investing based upon Your Goals
By Kelly Githens and Solomon Mutinda

First off, I’ve taken several different courses on investing in land. So, I have been exposed to a wide variety of ideas and this document is a combination of all the teachings. After assimilating all of these courses, I still felt insecure about where to invest and that is the genesis for this article.
When starting out as a Land Investor, probably the most important item is to find an area in which to invest based upon your Goals. Most land is segregated into different types of Uses, also known as Zoning. There is a huge diversity in zoning designations, most all of which fall under the major subcategories: Residential, Commercial, Multifamily, and Industrial. Here we are going to focus on three types of land: Rural Recreational, Infill Development and Subdividable.
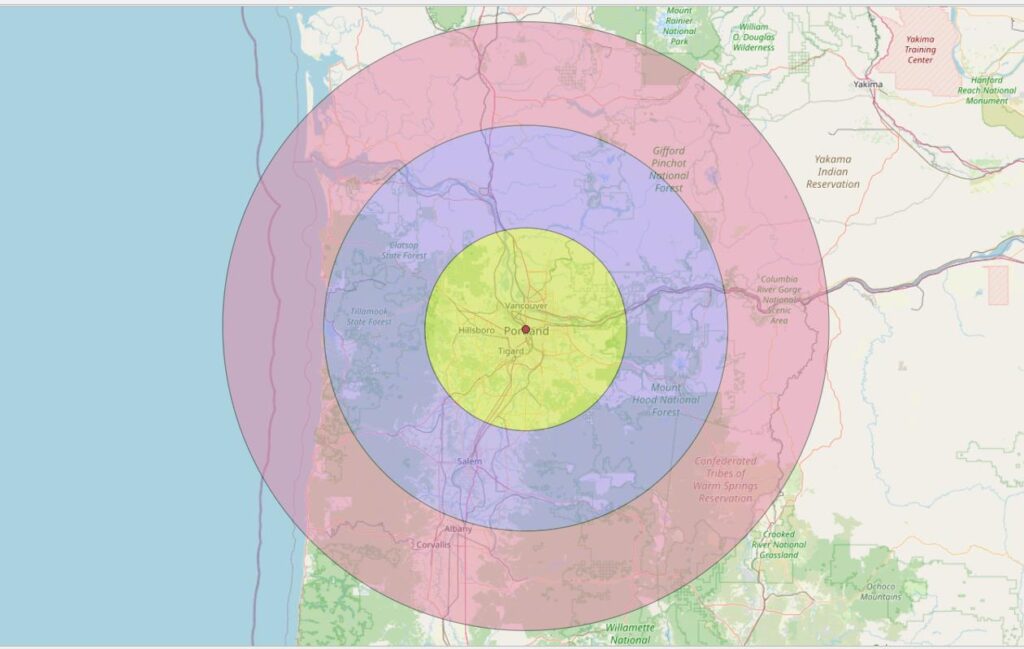
With all three types of investing, the first thing to do is to define your goals: Rural Recreational, which is cheap and plentiful; Residential Infill, which can be all over the place, both literally and figuratively; Subdividable, which tends to be larger and expensive. The primary methods of area selection are pretty much the same – at least to start with. The first thing you want to do is establish the Path of Progress. Most of the Experts agree the first thing to do is select a Metropolitan Statistical Area (MSA), which is an area which has at least one urbanized area with a population of 50,000 or more. Next thing to create concentric circles around the MSA of around 50, 100 and 150 miles, or roughly 2–3 hours distant from the heart of the MSA. The next item on our list is to identify all of the counties falling into our concentric circles.
To further verify your research, do a Google search for the fastest growing MSAs, Cities and Counties and reconcile your initial research with what you find are the fastest growing areas and why they are growing. To start you off, look at https://www.city-data.com/ or Census data. There are plenty of data sources out there to get you pointed in the right direction.
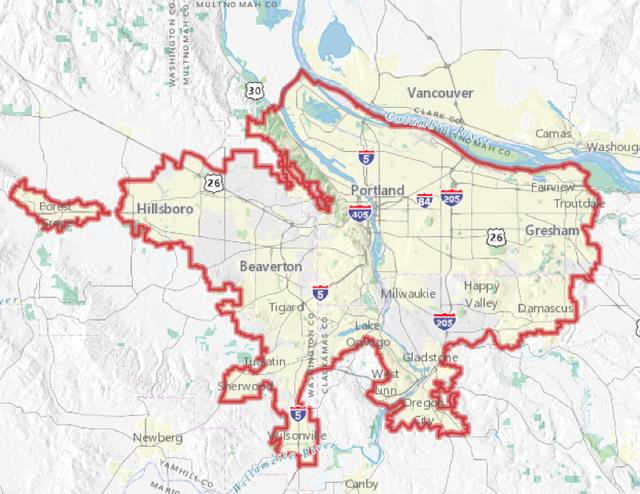
Next, it is important to identify Urban Growth Boundaries (UGB) in the primary area you have chosen. This is important so you can conceptualize where the developable land is around the area you’ve selected. A way to check and confirm this area is a check on new Building Permits. Generally speaking, most development will be contained and constrained within the UGB.
All these factors are important, but there is another facet to this search that I have not heard anyone focus on yet: New/Major Business Expansions. You want an area that has positive, sustainable growth. This requires research and a great place to get you started is: https://intellizence.com/insights/business-expansion/major-business-expansions/. This is a great source for helping plot the “Path of Progress” and lists, the Company, Location (most of the time), Type of Expansion/Development and sometimes the estimated amount of people affected. A current list of such Expansion/Development Project located in the spreadsheet below. Double-click on the spreadsheet and it becomes interactive.
New and Upcoming Projects in the Continental US
| Company Name | Location | What they do | Budget | Timeframe | People Affected |
|---|---|---|---|---|---|
| Redwood Materials | Northwest Nevada | Battery-materials | $3.5 billion | by 2025 | 1500 |
| Toyota Motor Corp | Northwest Nevada | Battery-materials | $1.80 billion | ||
| Texas Instrument | Sherman, TX | Facility to bolster a | $30 billion | by 2025 | 3000 |
| Enterprise Products | Beaumont, Texas | Produce 2 million tons of ethylene per year | $5 billion | by 2028 | |
| Brightspeed | Charlotte, NC | Build a significant portion of its planned fiber optics network | $2 billion | by 2022 | |
| The Lego Group | Chesterfield County, Virginia | Construct a 1.7 million- | $1 billion | by 2025 | 1,760 |
| Ely Lily | Concord, North Carolina | Construct a large | $1 billion | 600 | |
| Meta | Gallatin, TN | Expansion of its Gallatin | $1 billion | 1700 | |
| AT&T | Virginia | Invest in wireless and wireline networks |
Another way to confirm your thought process is to use another newer Tool called PRYCD. This tool is great for aggregating decision-making data, pricing out specific areas and creating all types of usable lists. As they provide the ability to create spreadsheets and manipulate the data, the spreadsheet below contains numerous metrics on the counties they have access to. Some of the metrics we considered to be important include: County Name, total number of Parcels, Sales, Listings, Days on Market, Economic Rankings and Population information. Double-click on the spreadsheet below and it becomes interactive. Consider ranking them based upon the data found in the New Business Developments/Expansions.
Extracted PRYCD Spreadsheet
Another way to confirm your thought process is to use another newer Tool called PRYCD. This tool is great for aggregating decision-making data, pricing out specific areas and creating all types of usable lists. As they provide the ability to create spreadsheets and manipulate the data, the spreadsheet below contains numerous metrics on the counties they have access to. Some of the metrics we considered to be important include: County Name, total number of Parcels, Sales, Listings, Days on Market, Economic Rankings and Population information. Double-click on the spreadsheet below and it becomes interactive. Consider ranking them based upon the data found in the New Business Developments/Expansions.
| State | Total DataTree Parcels | Total Comps | Sold Comps | For Sale Comps | Days on Market | Economic Rank | Population | Population Change % | Population-Sq Mile |
|---|---|---|---|---|---|---|---|---|---|
| Colorado | 25197 | 2914 | 1880 | 1901 | 105.5 | 28 | 18845 | 13.6 | 8.5 |
| Florida | 29154 | 2228 | 1717 | 2209 | 123.9 | 63 | 384902 | 16.2 | 167 |
| Florida | 20520 | 2315 | 1678 | 2102 | 125.9 | 234 | 42022 | 7.2 | 35.3 |
| Florida | 171182 | 3526 | 13913 | 11887 | 126.5 | 85 | 770577 | 19.5 | 635.8 |
| Florida | 24912 | 2443 | 1848 | 2146 | 130.9 | 414 | 174705 | 3.1 | 169.1 |
| Florida | 14160 | 3251 | 1470 | 1364 | 132.6 | 170 | 42168 | 5.1 | 47.3 |
| Florida | 104019 | 2624 | 8086 | 8893 | 135.7 | 101 | 188910 | 15.4 | 219.9 |
| Florida | 53984 | 2622 | 2763 | 3031 | 139.5 | 88 | 433742 | 12.4 | 598.1 |
| Oregon | 19367 | 1896 | 1218 | 1788 | 140.3 | 68 | 197692 | 20.2 | 64.7 |
| Colorado | 20205 | 4646 | 1991 | 1476 | 141.3 | 95 | 720403 | 13 | 338.3 |
| Florida | 24339 | 3252 | 2074 | 1926 | 145.2 | 348 | 115081 | 16.5 | 201.6 |
| Texas | 49992 | 2181 | 1087 | 1407 | 150.3 | 981 | 374264 | 16 | 234.3 |
| Texas | 56707 | 3218 | 1741 | 1622 | 150.8 | 611 | 607391 | 24.4 | 564.1 |
| Florida | 33483 | 6701 | 2096 | 1283 | 159.6 | 123 | 328297 | 15.2 | 477.1 |
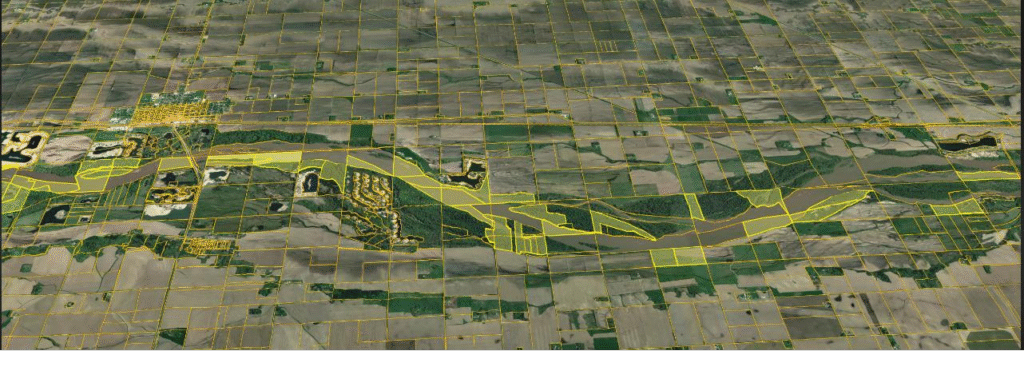
Now that you are this far, a great way to create a viable list along with those provided by County or other Third-Party Sources, is to use the concept of GIS Programmers. Geographic Information Systems (GIS) programmers utilize computer-based applications to collect, analyze, and model geographic or spatial data. As technology evolves, GIS Programmers have become both better at their craft and also more inexpensive. You can Google them, go to Craig’s List, Fiverr or Upwork and find an ample number of vendors more than willing to create you an interactive map containing all type of information, to include:
- They can plot your Concentric Circles
- They can plot all of the available parcels which meet your criteria on Google Maps
- Topographic features
- Road access
- Utilities
- Flood Zones
- Insert your imagination here...
The simplest, yet effective way to search for “Hot Spots” is to use Zillow, Redfin or Realtor.com, among others. Simply identify an area, select Land, then go to where you select how far back you want to go, then keep track of how many sales there were over: A year, six months, three months and one month. Then take a look at the current Listings and you can create a Tool which measures the velocity or number of transactions for the various time periods in relation to Listings.
For Rural Recreational Land, qualities for good counties include:
-
For recreational land, density per square mile is low and vice versa for infill development
-
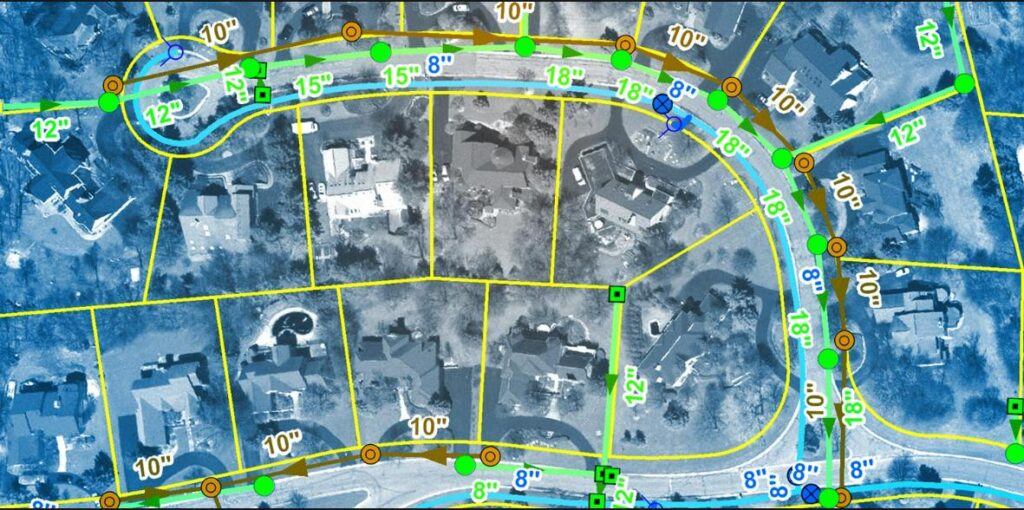
GIS is available to include access to infrastructure diagrams
-
Good activity with no more than 10% of the total existing inventory available/on the market at any one time
-
Relatively few investors
Other Physical Constraints:
-
Soil composition
-
Zoning
-
Topography/usability
-
Access to roadways
-
Access to utilities
-
Size
-
County records and sales history are accessible either from organic or third-party sources
-
Aesthetic amenities: Water features, mountains, etc
Infill Development Lots
Locating viable areas to invest in infill lots starts out pretty much the same as the search for rural recreational and subdividable land.
Among the various ways to locate prime infill lots is to go back to where there is predictable, sustainable population growth as well as where major businesses are developing relocating or expanding. This combination will definitely point you out the path of progress; it’s up to you to determine direction and velocity by doing some research into the municipalities which are impacted and determining infrastructure development through analysis of building permits, conversations with local planners and knowledgeable experts such as Realtors, Land Investors, Appraisers, etc.
Once you have decided upon an area, there are several ways to pick out prime development area candidates. One way is to use third-party sources such as Zillow, Redfin, Realtor.com and see what is available and what has been sold. Another option is to use GIS to locate and map existing inventory and then cross-reference with a reliable third-party data source such as Datatree, Propstream or various others. From this technique you can map and price out your list, looking for inefficiencies in the marketplace.
Infill lots, while they can be lucrative, are also fraught with danger in that the purchaser should have a good idea of where any given parcel is within the Entitlement process. The term caveat emptor applies here, and a comprehensive Checklist is mandatory.
Subdividable Land
This is one of the least discussed and most lucrative types of land. Again, there is a lot of danger, but also a lot of potential profit. Also, this assumes you have a background or are willing to learn about the Entitlement Process.
When looking for dirt which can be cut up, you’ve got to figure out what you’re going for and what type of infrastructure is in place. Whether Rural Recreational or Residential Development land, your best sources of information are going to be the Municipal Planner and the governing Zoning Code. For Recreational Land, you might get away with just road access in many instances. However, for Residential Development Land, you need to look for all of the elements of basic infrastructure: Road access, Topography, Water, Sewer, Electricity and nowadays, Internet connectivity.
When searching for this type of Land, you can start the search with a simple Third-Party Search (Zillow, Redfin, Realtor.com, Propstream, Datatree, etc.), but be ready to evolve into a search using GIS. This type of development has typically been reserved for the rich folks, but I have an interesting and exciting alternative to this. First, you need to identify individuals or groups focusing on this narrow niche, reaching out, making contact and finding what they want. Let’s say they want 5–25 acres of residential development land in Tennessee. So you do your search focusing on the UGB and utilizing a GIS Programmer, you identify a couple of parcels which have infrastructure in place. Next step is to do your research with respect to both the base Zoning and the Municipal Planner. Assuming your parcel has the “right stuff,” go into what is commonly called a Pre-Application Process, where you would submit a Rendering or picture of what might be and fill out any type of forms they require.
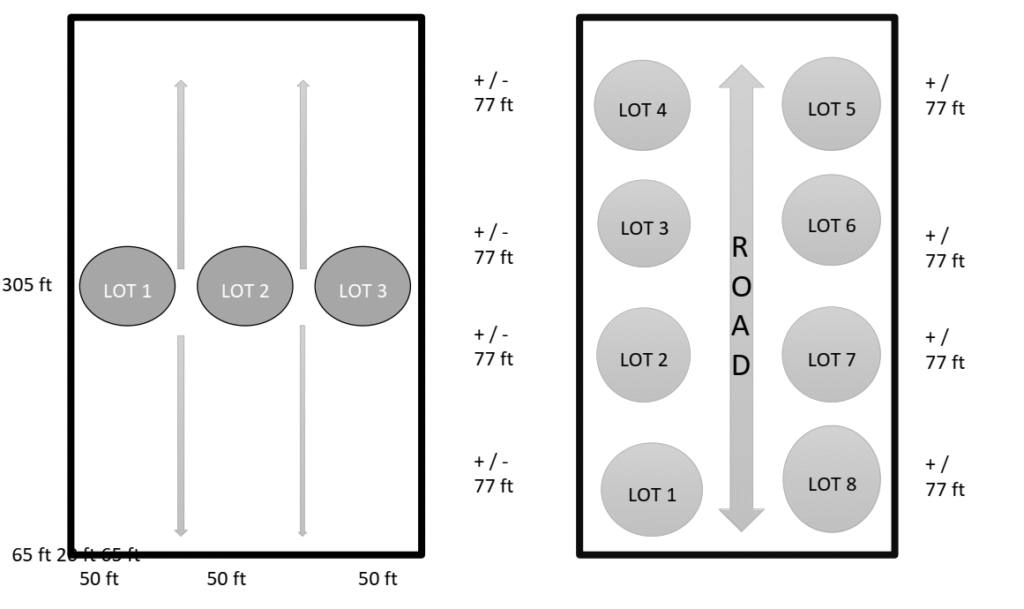
Here is a Rendering of a parcel I’ve worked on in Texas
From there, go back to the individual or group and introduce the idea along with an NDA, so no one can cut you out of the deal. I call this “selling the sizzle and not the steak.” An interesting idea, but it’s definitely not for everyone.
Finally, there is another excellent way to locate great locations, aka “Honey holes.”
They say that emulation is the sincerest form of flattery. What I mean here is look at other successful Land Investors and see where they are investing. There are a wide variety of third-party sources which can give you an intimate look at any given transaction. When looking at any given transaction, make sure to take note of as many of the following items as possible:
-
Original Purchase Price and Date
-
Current Listing Date
-
Current Sales Date (if closed)
-
Price
-
Days Exposed to the Market (DOM)
-
Location
-
Zoning
-
Size (Gross and net usable)
-
Topography
-
Accessibility
-
Utilities
From here you should be able to see patterns and, if you analyze the transaction history, you should be able to determine patterns relating to what the Investor paid versus what they sold or are selling for and their associated profit margins. These Gurus may not like it, but most of their transactions are of public records. However, don’t forget, many sophisticated investors may not buy with cash and may sell on contract. But you’re looking for aggregate data and trends, not just individual sales.
Most of this article is an amalgamation of some of the most successful Land Investors in today’s industry. Some of the items which make this article even somewhat noteworthy are the quantification of the Path of Progress and the layering of the different ideas and tools. While I could have kept some or all of these ideas to myself, I do believe in the Law of Abundance and believe there is enough of this “Land Pie” to go around.
Best of luck and if you wish to discuss this article further, don’t hesitate to contact us at:
📧 kellygith@gmail.com
📧 kelly@kdgland.com